 Sentinel Alcohol Detox
Key Numbers
- Listed treatment facilities
- 290closed listings excluded
- Facilities per 100,000 residents
- 4.712020 Census population
- Treatment deserts
- 33of 115 counties have no listed facility
- Residents of treatment deserts
- 460,612people in zero-facility counties
- Accept Medicaid
- 83.8%243 of 290 listed facilities
- Population
- 6,154,9132020 Census
Last updated , when the source report was generated.
These figures count listed facilities, not capacity or quality: a listing does not show how many people a facility can treat, how soon, or how well.
How the State Compares

Treatment Deserts
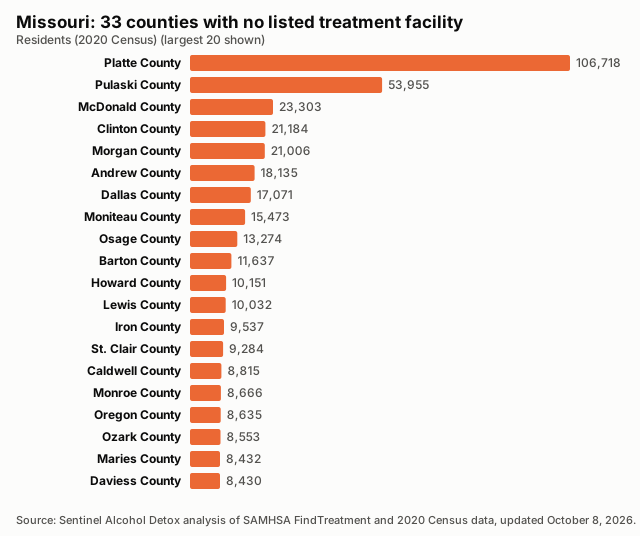
33 counties have no listed treatment facility. Distances are straight-line miles to the nearest listed facility.
| County | Population | Nearest listed facility (miles) |
|---|---|---|
| Platte County | 106,718 | 9.8 |
| Pulaski County | 53,955 | 24.4 |
| McDonald County | 23,303 | 16.8 |
| Clinton County | 21,184 | 13.6 |
| Morgan County | 21,006 | 16.8 |
| Andrew County | 18,135 | 13.9 |
| Dallas County | 17,071 | 20.1 |
| Moniteau County | 15,473 | 19.2 |
| Osage County | 13,274 | 18.3 |
| Barton County | 11,637 | 19.8 |
| Howard County | 10,151 | 11.9 |
| Lewis County | 10,032 | 14.9 |
| Iron County | 9,537 | 18.2 |
| St. Clair County | 9,284 | 17.3 |
| Caldwell County | 8,815 | 15.1 |
| Monroe County | 8,666 | 23.6 |
| Oregon County | 8,635 | 22.8 |
| Ozark County | 8,553 | 21.5 |
| Maries County | 8,432 | 16.9 |
| Daviess County | 8,430 | 19.7 |
| Hickory County | 8,279 | 22.2 |
| Harrison County | 8,157 | 19.3 |
| Chariton County | 7,408 | 19.5 |
| Gentry County | 6,162 | 25.9 |
| Shelby County | 6,103 | 20.1 |
| Atchison County | 5,305 | 21.2 |
| Scotland County | 4,716 | 21.9 |
| Putnam County | 4,681 | 15.1 |
| Holt County | 4,223 | 20.3 |
| Schuyler County | 4,032 | 19.1 |
| Knox County | 3,744 | 22.0 |
| Mercer County | 3,538 | 23.2 |
| Worth County | 1,973 | 26.3 |
Desert Counties by Population
Find Care Near Treatment Deserts
All Counties, Ranked
| Rank | County | Population | Listed facilities | Per 100,000 | Status |
|---|---|---|---|---|---|
| 1 | Wayne County | 10,974 | 3 | 27.34 | |
| 2 | Ralls County | 10,355 | 2 | 19.31 | |
| 3 | Carter County | 5,202 | 1 | 19.22 | |
| 4 | Bollinger County | 10,567 | 2 | 18.93 | |
| 5 | Cooper County | 17,103 | 3 | 17.54 | |
| 6 | Marion County | 28,525 | 5 | 17.53 | |
| 7 | Sullivan County | 5,999 | 1 | 16.67 | |
| 8 | Reynolds County | 6,096 | 1 | 16.40 | |
| 9 | Mississippi County | 12,577 | 2 | 15.90 | |
| 10 | Perry County | 18,956 | 3 | 15.83 | |
| 11 | Vernon County | 19,707 | 3 | 15.22 | |
| 12 | Clark County | 6,634 | 1 | 15.07 | |
| 13 | Shannon County | 7,031 | 1 | 14.22 | |
| 14 | Dunklin County | 28,283 | 4 | 14.14 | |
| 15 | Dent County | 14,421 | 2 | 13.87 | |
| 16 | Henry County | 21,946 | 3 | 13.67 | |
| 17 | Gasconade County | 14,794 | 2 | 13.52 | |
| 18 | Dade County | 7,569 | 1 | 13.21 | |
| 19 | Macon County | 15,209 | 2 | 13.15 | |
| 20 | Crawford County | 23,056 | 3 | 13.01 | |
| 21 | Howell County | 39,750 | 5 | 12.58 | |
| 22 | Lafayette County | 32,984 | 4 | 12.13 | |
| 23 | Audrain County | 24,962 | 3 | 12.02 | |
| 24 | Carroll County | 8,495 | 1 | 11.77 | |
| 25 | Lawrence County | 38,001 | 4 | 10.53 | |
| 26 | Grundy County | 9,808 | 1 | 10.20 | |
| 27 | Butler County | 42,130 | 4 | 9.49 | |
| 28 | Ripley County | 10,679 | 1 | 9.36 | |
| 29 | Camden County | 42,745 | 4 | 9.36 | |
| 30 | Johnson County | 54,013 | 5 | 9.26 | |
| 31 | DeKalb County | 11,029 | 1 | 9.07 | |
| 32 | Montgomery County | 11,322 | 1 | 8.83 | |
| 33 | Douglas County | 11,578 | 1 | 8.64 | |
| 34 | Saline County | 23,333 | 2 | 8.57 | |
| 35 | Newton County | 58,648 | 5 | 8.53 | |
| 36 | Linn County | 11,874 | 1 | 8.42 | |
| 37 | Randolph County | 24,716 | 2 | 8.09 | |
| 38 | Madison County | 12,626 | 1 | 7.92 | |
| 39 | Adair County | 25,314 | 2 | 7.90 | |
| 40 | Taney County | 56,066 | 4 | 7.13 | |
| 41 | Cedar County | 14,188 | 1 | 7.05 | |
| 42 | Livingston County | 14,557 | 1 | 6.87 | |
| 43 | Callaway County | 44,283 | 3 | 6.77 | |
| 44 | Phelps County | 44,638 | 3 | 6.72 | |
| 45 | Boone County | 183,610 | 12 | 6.54 | |
| 46 | Cole County | 77,279 | 5 | 6.47 | |
| 47 | Stone County | 31,076 | 2 | 6.44 | |
| 48 | Pemiscot County | 15,661 | 1 | 6.39 | |
| 49 | Polk County | 31,519 | 2 | 6.35 | |
| 50 | Bates County | 16,042 | 1 | 6.23 | |
| 51 | Cape Girardeau County | 81,710 | 5 | 6.12 | |
| 52 | New Madrid County | 16,434 | 1 | 6.08 | |
| 53 | Buchanan County | 84,793 | 5 | 5.90 | |
| 54 | Barry County | 34,534 | 2 | 5.79 | |
| 55 | Pike County | 17,587 | 1 | 5.69 | |
| 56 | Warren County | 35,532 | 2 | 5.63 | |
| 57 | Wright County | 18,188 | 1 | 5.50 | |
| 58 | Ste. Genevieve County | 18,479 | 1 | 5.41 | |
| 59 | St. Louis city | 301,578 | 16 | 5.31 | |
| 60 | Scott County | 38,059 | 2 | 5.25 | |
| 61 | Benton County | 19,394 | 1 | 5.16 | |
| 62 | Jasper County | 122,761 | 6 | 4.89 | |
| 63 | Franklin County | 104,682 | 5 | 4.78 | |
| 64 | Jackson County | 717,204 | 34 | 4.74 | |
| 65 | Nodaway County | 21,241 | 1 | 4.71 | |
| 66 | Greene County | 298,915 | 14 | 4.68 | |
| 67 | Pettis County | 42,980 | 2 | 4.65 | |
| 68 | Cass County | 107,824 | 5 | 4.64 | |
| 69 | St. Francois County | 66,922 | 3 | 4.48 | |
| 70 | Ray County | 23,158 | 1 | 4.32 | |
| 71 | Washington County | 23,514 | 1 | 4.25 | |
| 72 | Texas County | 24,487 | 1 | 4.08 | |
| 73 | Miller County | 24,722 | 1 | 4.04 | |
| 74 | Jefferson County | 226,739 | 8 | 3.53 | |
| 75 | Stoddard County | 28,672 | 1 | 3.49 | |
| 76 | St. Charles County | 405,262 | 14 | 3.45 | |
| 77 | Christian County | 88,842 | 3 | 3.38 | |
| 78 | Lincoln County | 59,574 | 2 | 3.36 | |
| 79 | Laclede County | 36,039 | 1 | 2.77 | |
| 80 | Webster County | 39,085 | 1 | 2.56 | |
| 81 | St. Louis County | 1,004,125 | 17 | 1.69 | |
| 82 | Clay County | 253,335 | 4 | 1.58 | |
| 83 | Andrew County | 18,135 | 0 | 0.00 | Treatment desert |
| 84 | Atchison County | 5,305 | 0 | 0.00 | Treatment desert |
| 85 | Barton County | 11,637 | 0 | 0.00 | Treatment desert |
| 86 | Caldwell County | 8,815 | 0 | 0.00 | Treatment desert |
| 87 | Chariton County | 7,408 | 0 | 0.00 | Treatment desert |
| 88 | Clinton County | 21,184 | 0 | 0.00 | Treatment desert |
| 89 | Dallas County | 17,071 | 0 | 0.00 | Treatment desert |
| 90 | Daviess County | 8,430 | 0 | 0.00 | Treatment desert |
| 91 | Gentry County | 6,162 | 0 | 0.00 | Treatment desert |
| 92 | Harrison County | 8,157 | 0 | 0.00 | Treatment desert |
| 93 | Hickory County | 8,279 | 0 | 0.00 | Treatment desert |
| 94 | Holt County | 4,223 | 0 | 0.00 | Treatment desert |
| 95 | Howard County | 10,151 | 0 | 0.00 | Treatment desert |
| 96 | Iron County | 9,537 | 0 | 0.00 | Treatment desert |
| 97 | Knox County | 3,744 | 0 | 0.00 | Treatment desert |
| 98 | Lewis County | 10,032 | 0 | 0.00 | Treatment desert |
| 99 | Maries County | 8,432 | 0 | 0.00 | Treatment desert |
| 100 | McDonald County | 23,303 | 0 | 0.00 | Treatment desert |
| 101 | Mercer County | 3,538 | 0 | 0.00 | Treatment desert |
| 102 | Moniteau County | 15,473 | 0 | 0.00 | Treatment desert |
| 103 | Monroe County | 8,666 | 0 | 0.00 | Treatment desert |
| 104 | Morgan County | 21,006 | 0 | 0.00 | Treatment desert |
| 105 | Oregon County | 8,635 | 0 | 0.00 | Treatment desert |
| 106 | Osage County | 13,274 | 0 | 0.00 | Treatment desert |
| 107 | Ozark County | 8,553 | 0 | 0.00 | Treatment desert |
| 108 | Platte County | 106,718 | 0 | 0.00 | Treatment desert |
| 109 | Pulaski County | 53,955 | 0 | 0.00 | Treatment desert |
| 110 | Putnam County | 4,681 | 0 | 0.00 | Treatment desert |
| 111 | Schuyler County | 4,032 | 0 | 0.00 | Treatment desert |
| 112 | Scotland County | 4,716 | 0 | 0.00 | Treatment desert |
| 113 | Shelby County | 6,103 | 0 | 0.00 | Treatment desert |
| 114 | St. Clair County | 9,284 | 0 | 0.00 | Treatment desert |
| 115 | Worth County | 1,973 | 0 | 0.00 | Treatment desert |
Methodology
Every number on this page is calculated directly from public records; no figure is estimated or written by hand.
Facilities are the treatment locations listed in SAMHSA's FindTreatment.gov locator, each counted once by its listing ID. Closed listings are excluded; active and unconfirmed listings are included (unique IDs; closed excluded; active and unconfirmed included).
Density divides the number of listed facilities by the 2020 Census resident population and multiplies by 100,000.
A treatment desert is a county with zero listed facilities. Facilities are placed in counties by their coordinates against Census county boundaries; deserts are only reported when every listed facility in the state has a verified county.
The Medicaid share is the number of listed facilities that report accepting Medicaid divided by all listed facilities; facilities that do not report it count as not confirmed.
Distances are straight-line (great-circle) miles from a county's Census reference point to the nearest geocoded listed facility in any state. They are not driving distances.
These are listed facilities, not capacity or quality: counts describe listings, not beds, wait times, outcomes or proof of access to care.
Known Gaps in This Data
- None reported for this state.
Sources and Reuse
- SAMHSA FindTreatment.gov treatment locator (Substance Abuse and Mental Health Services Administration): Listed treatment facilities, operating status and Medicaid acceptance.
- 2020 Census redistricting data (P.L. 94-171), table P1 (U.S. Census Bureau): State and county resident population (2020).
- 2020 cartographic boundary files, counties (1:500,000) (U.S. Census Bureau): County boundaries for assigning facilities to counties and for the county map.
- 2020 Census Gazetteer files, counties (U.S. Census Bureau): County reference points for nearest-facility distances.
Download this data: County table (CSV) · Full data (JSON)
Licence: this data and its charts are published under the Creative Commons Attribution 4.0 (CC BY 4.0) licence. You may copy, share and adapt them, including commercially. Attribution: credit Sentinel Alcohol Detox and link to the source page, https://sentinelalcoholdetox.com/data/missouri/.