 Sentinel Alcohol Detox
Key Numbers
- Listed treatment facilities
- 371closed listings excluded
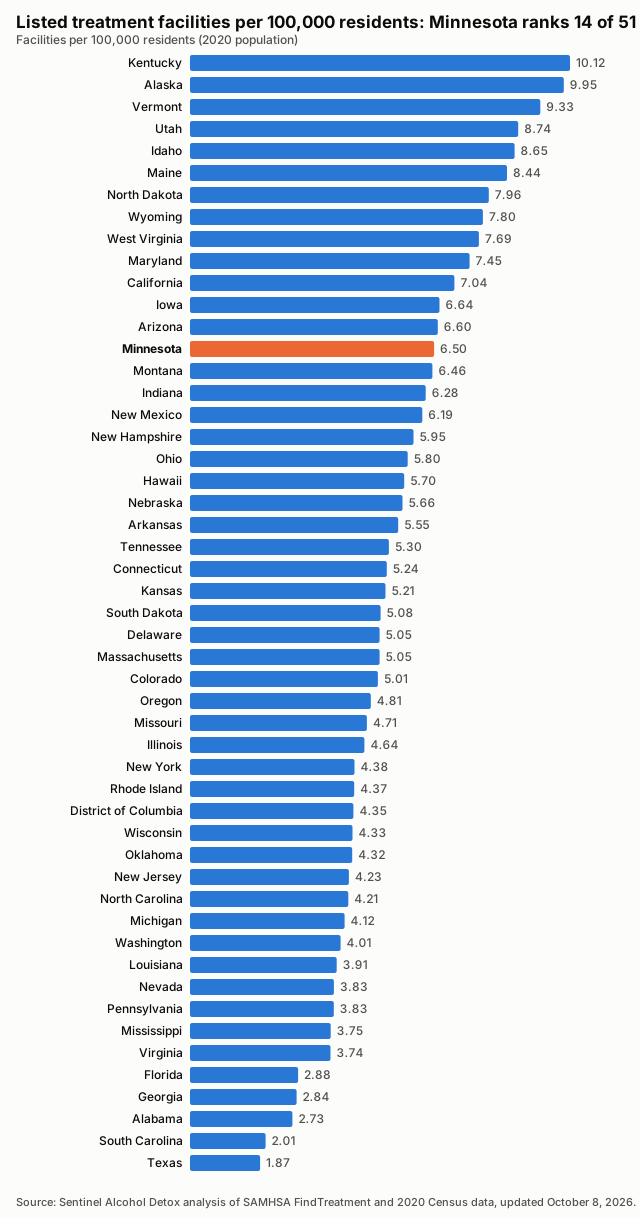
- Facilities per 100,000 residents
- 6.502020 Census population
- Treatment deserts
- Not availablecounty catalogue incomplete
- Residents of treatment deserts
- Not availablepeople in zero-facility counties
- Accept Medicaid
- 93.3%346 of 371 listed facilities
- Population
- 5,706,4942020 Census
Last updated , when the source report was generated.
These figures count listed facilities, not capacity or quality: a listing does not show how many people a facility can treat, how soon, or how well.
How the State Compares
Treatment Deserts
Treatment deserts cannot be established for this state from the current input; see the known gaps under Methodology.
Desert Counties by Population

All Counties, Ranked
| Rank | County | Population | Listed facilities | Per 100,000 | Status |
|---|---|---|---|---|---|
| 1 | Itasca County | 45,014 | 8 | 17.77 | |
| 2 | Koochiching County | 12,062 | 2 | 16.58 | |
| 3 | Carlton County | 36,207 | 6 | 16.57 | |
| 4 | Chippewa County | 12,598 | 2 | 15.88 | |
| 5 | Wilkin County | 6,506 | 1 | 15.37 | |
| 6 | Beltrami County | 46,228 | 7 | 15.14 | |
| 7 | Martin County | 20,025 | 3 | 14.98 | |
| 8 | Redwood County | 15,425 | 2 | 12.97 | |
| 9 | Freeborn County | 30,895 | 4 | 12.95 | |
| 10 | Polk County | 31,192 | 4 | 12.82 | |
| 11 | St. Louis County | 200,231 | 24 | 11.99 | |
| 12 | Blue Earth County | 69,112 | 8 | 11.58 | |
| 13 | Kandiyohi County | 43,732 | 5 | 11.43 | |
| 14 | Steele County | 37,406 | 4 | 10.69 | |
| 15 | Pine County | 28,876 | 3 | 10.39 | |
| 16 | Rock County | 9,704 | 1 | 10.31 | |
| 17 | Douglas County | 39,006 | 4 | 10.25 | |
| 18 | Olmsted County | 162,847 | 15 | 9.21 | |
| 19 | Lake County | 10,905 | 1 | 9.17 | |
| 20 | Crow Wing County | 66,123 | 6 | 9.07 | |
| 21 | Stearns County | 158,292 | 14 | 8.84 | |
| 22 | Cottonwood County | 11,517 | 1 | 8.68 | |
| 23 | Meeker County | 23,400 | 2 | 8.55 | |
| 24 | Wright County | 141,337 | 12 | 8.49 | |
| 25 | Lyon County | 25,269 | 2 | 7.91 | |
| 26 | Clay County | 65,318 | 5 | 7.65 | |
| 27 | Mille Lacs County | 26,459 | 2 | 7.56 | |
| 28 | Mower County | 40,029 | 3 | 7.49 | |
| 29 | Ramsey County | 552,352 | 41 | 7.42 | |
| 30 | Pennington County | 13,992 | 1 | 7.15 | |
| 31 | Wadena County | 14,065 | 1 | 7.11 | |
| 32 | Le Sueur County | 28,674 | 2 | 6.97 | |
| 33 | Cass County | 30,066 | 2 | 6.65 | |
| 34 | Kanabec County | 16,032 | 1 | 6.24 | |
| 35 | Winona County | 49,671 | 3 | 6.04 | |
| 36 | Washington County | 267,568 | 16 | 5.98 | |
| 37 | Rice County | 67,097 | 4 | 5.96 | |
| 38 | Morrison County | 34,010 | 2 | 5.88 | |
| 39 | Nicollet County | 34,454 | 2 | 5.80 | |
| 40 | Hennepin County | 1,281,565 | 74 | 5.77 | |
| 41 | Becker County | 35,183 | 2 | 5.68 | |
| 42 | Carver County | 106,922 | 6 | 5.61 | |
| 43 | McLeod County | 36,771 | 2 | 5.44 | |
| 44 | Houston County | 18,843 | 1 | 5.31 | |
| 45 | Chisago County | 56,621 | 3 | 5.30 | |
| 46 | Otter Tail County | 60,081 | 3 | 4.99 | |
| 47 | Anoka County | 363,887 | 18 | 4.95 | |
| 48 | Isanti County | 41,135 | 2 | 4.86 | |
| 49 | Benton County | 41,379 | 2 | 4.83 | |
| 50 | Dodge County | 20,867 | 1 | 4.79 | |
| 51 | Hubbard County | 21,344 | 1 | 4.69 | |
| 52 | Goodhue County | 47,582 | 2 | 4.20 | |
| 53 | Sherburne County | 97,183 | 4 | 4.12 | |
| 54 | Scott County | 150,928 | 6 | 3.98 | |
| 55 | Todd County | 25,262 | 1 | 3.96 | |
| 56 | Brown County | 25,912 | 1 | 3.86 | |
| 57 | Dakota County | 439,882 | 15 | 3.41 | |
| 58 | Aitkin County | 15,697 | 0 | 0.00 | Unknown |
| 59 | Big Stone County | 5,166 | 0 | 0.00 | Unknown |
| 60 | Clearwater County | 8,524 | 0 | 0.00 | Unknown |
| 61 | Cook County | 5,600 | 0 | 0.00 | Unknown |
| 62 | Faribault County | 13,921 | 0 | 0.00 | Unknown |
| 63 | Fillmore County | 21,228 | 0 | 0.00 | Unknown |
| 64 | Grant County | 6,074 | 0 | 0.00 | Unknown |
| 65 | Jackson County | 9,989 | 0 | 0.00 | Unknown |
| 66 | Kittson County | 4,207 | 0 | 0.00 | Unknown |
| 67 | Lac qui Parle County | 6,719 | 0 | 0.00 | Unknown |
| 68 | Lake of the Woods County | 3,763 | 0 | 0.00 | Unknown |
| 69 | Lincoln County | 5,640 | 0 | 0.00 | Unknown |
| 70 | Mahnomen County | 5,411 | 0 | 0.00 | Unknown |
| 71 | Marshall County | 9,040 | 0 | 0.00 | Unknown |
| 72 | Murray County | 8,179 | 0 | 0.00 | Unknown |
| 73 | Nobles County | 22,290 | 0 | 0.00 | Unknown |
| 74 | Norman County | 6,441 | 0 | 0.00 | Unknown |
| 75 | Pipestone County | 9,424 | 0 | 0.00 | Unknown |
| 76 | Pope County | 11,308 | 0 | 0.00 | Unknown |
| 77 | Red Lake County | 3,935 | 0 | 0.00 | Unknown |
| 78 | Renville County | 14,723 | 0 | 0.00 | Unknown |
| 79 | Roseau County | 15,331 | 0 | 0.00 | Unknown |
| 80 | Sibley County | 14,836 | 0 | 0.00 | Unknown |
| 81 | Stevens County | 9,671 | 0 | 0.00 | Unknown |
| 82 | Swift County | 9,838 | 0 | 0.00 | Unknown |
| 83 | Traverse County | 3,360 | 0 | 0.00 | Unknown |
| 84 | Wabasha County | 21,387 | 0 | 0.00 | Unknown |
| 85 | Waseca County | 18,968 | 0 | 0.00 | Unknown |
| 86 | Watonwan County | 11,253 | 0 | 0.00 | Unknown |
| 87 | Yellow Medicine County | 9,528 | 0 | 0.00 | Unknown |
Methodology
Every number on this page is calculated directly from public records; no figure is estimated or written by hand.
Facilities are the treatment locations listed in SAMHSA's FindTreatment.gov locator, each counted once by its listing ID. Closed listings are excluded; active and unconfirmed listings are included (unique IDs; closed excluded; active and unconfirmed included).
Density divides the number of listed facilities by the 2020 Census resident population and multiplies by 100,000.
A treatment desert is a county with zero listed facilities. Facilities are placed in counties by their coordinates against Census county boundaries; deserts are only reported when every listed facility in the state has a verified county.
The Medicaid share is the number of listed facilities that report accepting Medicaid divided by all listed facilities; facilities that do not report it count as not confirmed.
Distances are straight-line (great-circle) miles from a county's Census reference point to the nearest geocoded listed facility in any state. They are not driving distances.
These are listed facilities, not capacity or quality: counts describe listings, not beds, wait times, outcomes or proof of access to care.
Known Gaps in This Data
- 1 facilities lack a verified county assignment; zero-count counties remain unknown.
Sources and Reuse
- SAMHSA FindTreatment.gov treatment locator (Substance Abuse and Mental Health Services Administration): Listed treatment facilities, operating status and Medicaid acceptance.
- 2020 Census redistricting data (P.L. 94-171), table P1 (U.S. Census Bureau): State and county resident population (2020).
- 2020 cartographic boundary files, counties (1:500,000) (U.S. Census Bureau): County boundaries for assigning facilities to counties and for the county map.
- 2020 Census Gazetteer files, counties (U.S. Census Bureau): County reference points for nearest-facility distances.
Download this data: County table (CSV) · Full data (JSON)
Licence: this data and its charts are published under the Creative Commons Attribution 4.0 (CC BY 4.0) licence. You may copy, share and adapt them, including commercially. Attribution: credit Sentinel Alcohol Detox and link to the source page, https://sentinelalcoholdetox.com/data/minnesota/.