 Sentinel Alcohol Detox
Key Numbers
- Listed treatment facilities
- 355closed listings excluded
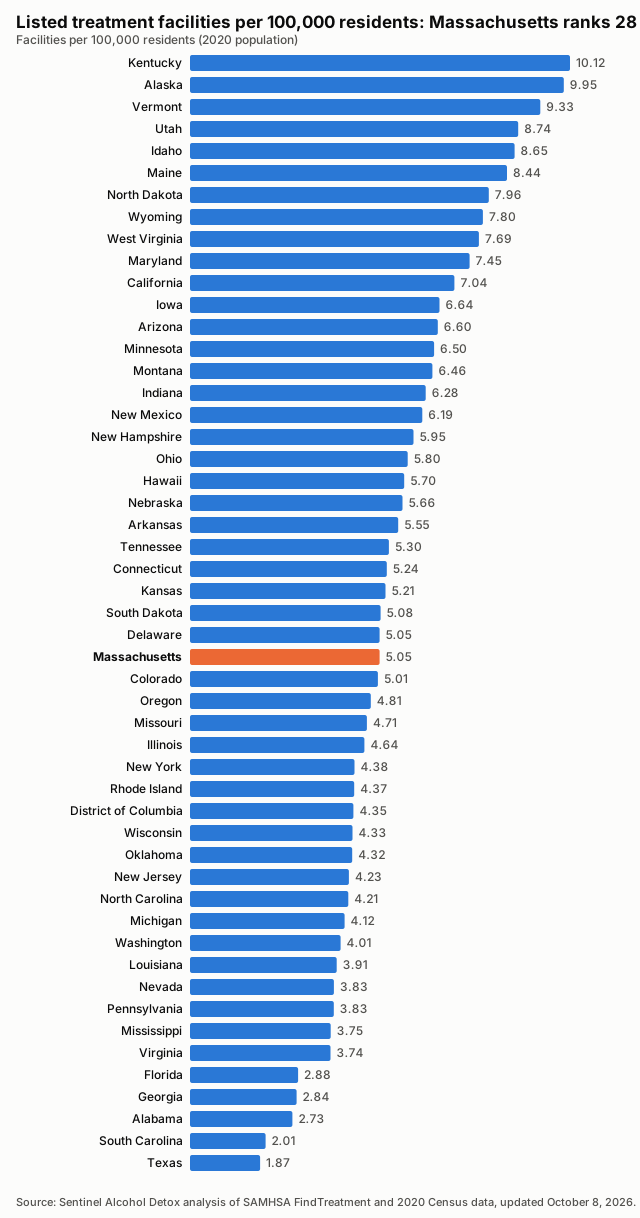
- Facilities per 100,000 residents
- 5.052020 Census population
- Treatment deserts
- 1of 14 counties have no listed facility
- Residents of treatment deserts
- 20,600people in zero-facility counties
- Accept Medicaid
- 91.8%326 of 355 listed facilities
- Population
- 7,029,9172020 Census
Last updated , when the source report was generated.
These figures count listed facilities, not capacity or quality: a listing does not show how many people a facility can treat, how soon, or how well.
How the State Compares
Treatment Deserts
1 county has no listed treatment facility. Distances are straight-line miles to the nearest listed facility.
| County | Population | Nearest listed facility (miles) |
|---|---|---|
| Dukes County | 20,600 | 13.4 |
Desert Counties by Population

Find Care Near Treatment Deserts
All Counties, Ranked
| Rank | County | Population | Listed facilities | Per 100,000 | Status |
|---|---|---|---|---|---|
| 1 | Berkshire County | 129,026 | 18 | 13.95 | |
| 2 | Franklin County | 71,029 | 7 | 9.86 | |
| 3 | Worcester County | 862,111 | 65 | 7.54 | |
| 4 | Nantucket County | 14,255 | 1 | 7.02 | |
| 5 | Barnstable County | 228,996 | 14 | 6.11 | |
| 6 | Hampden County | 465,825 | 27 | 5.80 | |
| 7 | Bristol County | 579,200 | 33 | 5.70 | |
| 8 | Suffolk County | 797,936 | 43 | 5.39 | |
| 9 | Hampshire County | 162,308 | 8 | 4.93 | |
| 10 | Plymouth County | 530,819 | 23 | 4.33 | |
| 11 | Essex County | 809,829 | 32 | 3.95 | |
| 12 | Middlesex County | 1,632,002 | 60 | 3.68 | |
| 13 | Norfolk County | 725,981 | 24 | 3.31 | |
| 14 | Dukes County | 20,600 | 0 | 0.00 | Treatment desert |
Methodology
Every number on this page is calculated directly from public records; no figure is estimated or written by hand.
Facilities are the treatment locations listed in SAMHSA's FindTreatment.gov locator, each counted once by its listing ID. Closed listings are excluded; active and unconfirmed listings are included (unique IDs; closed excluded; active and unconfirmed included).
Density divides the number of listed facilities by the 2020 Census resident population and multiplies by 100,000.
A treatment desert is a county with zero listed facilities. Facilities are placed in counties by their coordinates against Census county boundaries; deserts are only reported when every listed facility in the state has a verified county.
The Medicaid share is the number of listed facilities that report accepting Medicaid divided by all listed facilities; facilities that do not report it count as not confirmed.
Distances are straight-line (great-circle) miles from a county's Census reference point to the nearest geocoded listed facility in any state. They are not driving distances.
These are listed facilities, not capacity or quality: counts describe listings, not beds, wait times, outcomes or proof of access to care.
Known Gaps in This Data
- None reported for this state.
Sources and Reuse
- SAMHSA FindTreatment.gov treatment locator (Substance Abuse and Mental Health Services Administration): Listed treatment facilities, operating status and Medicaid acceptance.
- 2020 Census redistricting data (P.L. 94-171), table P1 (U.S. Census Bureau): State and county resident population (2020).
- 2020 cartographic boundary files, counties (1:500,000) (U.S. Census Bureau): County boundaries for assigning facilities to counties and for the county map.
- 2020 Census Gazetteer files, counties (U.S. Census Bureau): County reference points for nearest-facility distances.
Download this data: County table (CSV) · Full data (JSON)
Licence: this data and its charts are published under the Creative Commons Attribution 4.0 (CC BY 4.0) licence. You may copy, share and adapt them, including commercially. Attribution: credit Sentinel Alcohol Detox and link to the source page, https://sentinelalcoholdetox.com/data/massachusetts/.