 Sentinel Alcohol Detox
Key Numbers
- Listed treatment facilities
- 153closed listings excluded
- Facilities per 100,000 residents
- 5.212020 Census population
- Treatment deserts
- 44of 105 counties have no listed facility
- Residents of treatment deserts
- 200,947people in zero-facility counties
- Accept Medicaid
- 86.9%133 of 153 listed facilities
- Population
- 2,937,8802020 Census
Last updated , when the source report was generated.
These figures count listed facilities, not capacity or quality: a listing does not show how many people a facility can treat, how soon, or how well.
How the State Compares

Treatment Deserts
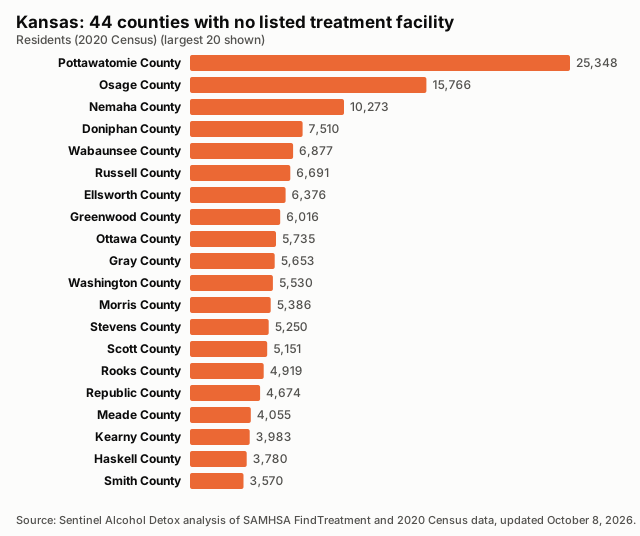
44 counties have no listed treatment facility. Distances are straight-line miles to the nearest listed facility.
| County | Population | Nearest listed facility (miles) |
|---|---|---|
| Pottawatomie County | 25,348 | 18.8 |
| Osage County | 15,766 | 23.5 |
| Nemaha County | 10,273 | 25.6 |
| Doniphan County | 7,510 | 14.0 |
| Wabaunsee County | 6,877 | 24.0 |
| Russell County | 6,691 | 30.2 |
| Ellsworth County | 6,376 | 24.3 |
| Greenwood County | 6,016 | 33.6 |
| Ottawa County | 5,735 | 19.1 |
| Gray County | 5,653 | 24.6 |
| Washington County | 5,530 | 23.9 |
| Morris County | 5,386 | 25.2 |
| Stevens County | 5,250 | 23.8 |
| Scott County | 5,151 | 24.3 |
| Rooks County | 4,919 | 28.4 |
| Republic County | 4,674 | 17.8 |
| Meade County | 4,055 | 33.9 |
| Kearny County | 3,983 | 23.8 |
| Haskell County | 3,780 | 26.3 |
| Smith County | 3,570 | 23.6 |
| Woodson County | 3,115 | 19.5 |
| Rush County | 2,956 | 23.9 |
| Lincoln County | 2,939 | 30.2 |
| Edwards County | 2,907 | 19.5 |
| Trego County | 2,808 | 29.0 |
| Decatur County | 2,764 | 30.1 |
| Logan County | 2,762 | 33.3 |
| Gove County | 2,718 | 30.4 |
| Morton County | 2,701 | 37.0 |
| Ness County | 2,687 | 29.7 |
| Cheyenne County | 2,616 | 30.3 |
| Chase County | 2,572 | 21.5 |
| Rawlins County | 2,561 | 27.5 |
| Hamilton County | 2,518 | 37.0 |
| Elk County | 2,483 | 24.3 |
| Sheridan County | 2,447 | 32.9 |
| Graham County | 2,415 | 32.7 |
| Wichita County | 2,152 | 44.0 |
| Stanton County | 2,084 | 23.6 |
| Clark County | 1,991 | 37.1 |
| Hodgeman County | 1,723 | 23.7 |
| Comanche County | 1,689 | 29.1 |
| Wallace County | 1,512 | 29.5 |
| Greeley County | 1,284 | 37.6 |
Desert Counties by Population
Find Care Near Treatment Deserts
All Counties, Ranked
| Rank | County | Population | Listed facilities | Per 100,000 | Status |
|---|---|---|---|---|---|
| 1 | Lane County | 1,574 | 1 | 63.53 | |
| 2 | Barber County | 4,228 | 2 | 47.30 | |
| 3 | Kiowa County | 2,460 | 1 | 40.65 | |
| 4 | Norton County | 5,459 | 2 | 36.64 | |
| 5 | Harper County | 5,485 | 2 | 36.46 | |
| 6 | Jewell County | 2,932 | 1 | 34.11 | |
| 7 | Pawnee County | 6,253 | 2 | 31.98 | |
| 8 | Chautauqua County | 3,379 | 1 | 29.59 | |
| 9 | Osborne County | 3,500 | 1 | 28.57 | |
| 10 | Stafford County | 4,072 | 1 | 24.56 | |
| 11 | Cloud County | 9,032 | 2 | 22.14 | |
| 12 | Pratt County | 9,157 | 2 | 21.84 | |
| 13 | Phillips County | 4,981 | 1 | 20.08 | |
| 14 | Mitchell County | 5,796 | 1 | 17.25 | |
| 15 | Sherman County | 5,927 | 1 | 16.87 | |
| 16 | Cherokee County | 19,362 | 3 | 15.49 | |
| 17 | Bourbon County | 14,360 | 2 | 13.93 | |
| 18 | Grant County | 7,352 | 1 | 13.60 | |
| 19 | Kingman County | 7,470 | 1 | 13.39 | |
| 20 | Anderson County | 7,836 | 1 | 12.76 | |
| 21 | Thomas County | 7,930 | 1 | 12.61 | |
| 22 | Neosho County | 15,904 | 2 | 12.58 | |
| 23 | Clay County | 8,117 | 1 | 12.32 | |
| 24 | Atchison County | 16,348 | 2 | 12.23 | |
| 25 | Coffey County | 8,360 | 1 | 11.96 | |
| 26 | Harvey County | 34,024 | 4 | 11.76 | |
| 27 | Wilson County | 8,624 | 1 | 11.60 | |
| 28 | Dickinson County | 18,402 | 2 | 10.87 | |
| 29 | Rice County | 9,427 | 1 | 10.61 | |
| 30 | Brown County | 9,508 | 1 | 10.52 | |
| 31 | Linn County | 9,591 | 1 | 10.43 | |
| 32 | Marshall County | 10,038 | 1 | 9.96 | |
| 33 | McPherson County | 30,223 | 3 | 9.93 | |
| 34 | Saline County | 54,303 | 5 | 9.21 | |
| 35 | Miami County | 34,191 | 3 | 8.77 | |
| 36 | Marion County | 11,823 | 1 | 8.46 | |
| 37 | Allen County | 12,526 | 1 | 7.98 | |
| 38 | Barton County | 25,493 | 2 | 7.85 | |
| 39 | Crawford County | 38,972 | 3 | 7.70 | |
| 40 | Jackson County | 13,232 | 1 | 7.56 | |
| 41 | Reno County | 61,898 | 4 | 6.46 | |
| 42 | Montgomery County | 31,486 | 2 | 6.35 | |
| 43 | Lyon County | 32,179 | 2 | 6.22 | |
| 44 | Ford County | 34,287 | 2 | 5.83 | |
| 45 | Cowley County | 34,549 | 2 | 5.79 | |
| 46 | Jefferson County | 18,368 | 1 | 5.44 | |
| 47 | Geary County | 36,739 | 2 | 5.44 | |
| 48 | Finney County | 38,470 | 2 | 5.20 | |
| 49 | Labette County | 20,184 | 1 | 4.95 | |
| 50 | Seward County | 21,964 | 1 | 4.55 | |
| 51 | Shawnee County | 178,909 | 8 | 4.47 | |
| 52 | Sumner County | 22,382 | 1 | 4.47 | |
| 53 | Butler County | 67,380 | 3 | 4.45 | |
| 54 | Douglas County | 118,785 | 5 | 4.21 | |
| 55 | Sedgwick County | 523,824 | 21 | 4.01 | |
| 56 | Franklin County | 25,996 | 1 | 3.85 | |
| 57 | Wyandotte County | 169,245 | 6 | 3.55 | |
| 58 | Ellis County | 28,934 | 1 | 3.46 | |
| 59 | Johnson County | 609,863 | 19 | 3.12 | |
| 60 | Leavenworth County | 81,881 | 2 | 2.44 | |
| 61 | Riley County | 71,959 | 1 | 1.39 | |
| 62 | Chase County | 2,572 | 0 | 0.00 | Treatment desert |
| 63 | Cheyenne County | 2,616 | 0 | 0.00 | Treatment desert |
| 64 | Clark County | 1,991 | 0 | 0.00 | Treatment desert |
| 65 | Comanche County | 1,689 | 0 | 0.00 | Treatment desert |
| 66 | Decatur County | 2,764 | 0 | 0.00 | Treatment desert |
| 67 | Doniphan County | 7,510 | 0 | 0.00 | Treatment desert |
| 68 | Edwards County | 2,907 | 0 | 0.00 | Treatment desert |
| 69 | Elk County | 2,483 | 0 | 0.00 | Treatment desert |
| 70 | Ellsworth County | 6,376 | 0 | 0.00 | Treatment desert |
| 71 | Gove County | 2,718 | 0 | 0.00 | Treatment desert |
| 72 | Graham County | 2,415 | 0 | 0.00 | Treatment desert |
| 73 | Gray County | 5,653 | 0 | 0.00 | Treatment desert |
| 74 | Greeley County | 1,284 | 0 | 0.00 | Treatment desert |
| 75 | Greenwood County | 6,016 | 0 | 0.00 | Treatment desert |
| 76 | Hamilton County | 2,518 | 0 | 0.00 | Treatment desert |
| 77 | Haskell County | 3,780 | 0 | 0.00 | Treatment desert |
| 78 | Hodgeman County | 1,723 | 0 | 0.00 | Treatment desert |
| 79 | Kearny County | 3,983 | 0 | 0.00 | Treatment desert |
| 80 | Lincoln County | 2,939 | 0 | 0.00 | Treatment desert |
| 81 | Logan County | 2,762 | 0 | 0.00 | Treatment desert |
| 82 | Meade County | 4,055 | 0 | 0.00 | Treatment desert |
| 83 | Morris County | 5,386 | 0 | 0.00 | Treatment desert |
| 84 | Morton County | 2,701 | 0 | 0.00 | Treatment desert |
| 85 | Nemaha County | 10,273 | 0 | 0.00 | Treatment desert |
| 86 | Ness County | 2,687 | 0 | 0.00 | Treatment desert |
| 87 | Osage County | 15,766 | 0 | 0.00 | Treatment desert |
| 88 | Ottawa County | 5,735 | 0 | 0.00 | Treatment desert |
| 89 | Pottawatomie County | 25,348 | 0 | 0.00 | Treatment desert |
| 90 | Rawlins County | 2,561 | 0 | 0.00 | Treatment desert |
| 91 | Republic County | 4,674 | 0 | 0.00 | Treatment desert |
| 92 | Rooks County | 4,919 | 0 | 0.00 | Treatment desert |
| 93 | Rush County | 2,956 | 0 | 0.00 | Treatment desert |
| 94 | Russell County | 6,691 | 0 | 0.00 | Treatment desert |
| 95 | Scott County | 5,151 | 0 | 0.00 | Treatment desert |
| 96 | Sheridan County | 2,447 | 0 | 0.00 | Treatment desert |
| 97 | Smith County | 3,570 | 0 | 0.00 | Treatment desert |
| 98 | Stanton County | 2,084 | 0 | 0.00 | Treatment desert |
| 99 | Stevens County | 5,250 | 0 | 0.00 | Treatment desert |
| 100 | Trego County | 2,808 | 0 | 0.00 | Treatment desert |
| 101 | Wabaunsee County | 6,877 | 0 | 0.00 | Treatment desert |
| 102 | Wallace County | 1,512 | 0 | 0.00 | Treatment desert |
| 103 | Washington County | 5,530 | 0 | 0.00 | Treatment desert |
| 104 | Wichita County | 2,152 | 0 | 0.00 | Treatment desert |
| 105 | Woodson County | 3,115 | 0 | 0.00 | Treatment desert |
Methodology
Every number on this page is calculated directly from public records; no figure is estimated or written by hand.
Facilities are the treatment locations listed in SAMHSA's FindTreatment.gov locator, each counted once by its listing ID. Closed listings are excluded; active and unconfirmed listings are included (unique IDs; closed excluded; active and unconfirmed included).
Density divides the number of listed facilities by the 2020 Census resident population and multiplies by 100,000.
A treatment desert is a county with zero listed facilities. Facilities are placed in counties by their coordinates against Census county boundaries; deserts are only reported when every listed facility in the state has a verified county.
The Medicaid share is the number of listed facilities that report accepting Medicaid divided by all listed facilities; facilities that do not report it count as not confirmed.
Distances are straight-line (great-circle) miles from a county's Census reference point to the nearest geocoded listed facility in any state. They are not driving distances.
These are listed facilities, not capacity or quality: counts describe listings, not beds, wait times, outcomes or proof of access to care.
Known Gaps in This Data
- None reported for this state.
Sources and Reuse
- SAMHSA FindTreatment.gov treatment locator (Substance Abuse and Mental Health Services Administration): Listed treatment facilities, operating status and Medicaid acceptance.
- 2020 Census redistricting data (P.L. 94-171), table P1 (U.S. Census Bureau): State and county resident population (2020).
- 2020 cartographic boundary files, counties (1:500,000) (U.S. Census Bureau): County boundaries for assigning facilities to counties and for the county map.
- 2020 Census Gazetteer files, counties (U.S. Census Bureau): County reference points for nearest-facility distances.
Download this data: County table (CSV) · Full data (JSON)
Licence: this data and its charts are published under the Creative Commons Attribution 4.0 (CC BY 4.0) licence. You may copy, share and adapt them, including commercially. Attribution: credit Sentinel Alcohol Detox and link to the source page, https://sentinelalcoholdetox.com/data/kansas/.